
ARTICLE
CBAM EMBEDDED CARBON
MODELLING AND CALCULATION
MODELLING AND CALCULATION
ARTICLE
ARTICLE
20 FEBRUARY 2024

Context for the need to calculate Embedded Carbon of CBAM Products
With the commencement of EU’s Carbon Border Adjustment Mechanism (CBAM) transitional period, to comply with CBAM quarterly reporting, EU Importers / Declarants would require Embedded Carbon numbers of the various CBAM Products and information of Carbon Price paid at production country from their Non-EU Suppliers / Producers. While the definitive period for CBAM reporting will only start in 2026, it is advisable that Non-EU Producers begin to calculate their CBAM products embedded carbon. Right now, the sectors in scope cover Iron & Steel, Aluminium, Fertiliser, Cement, Hydrogen and Electricity.
This article is not about the CBAM reporting requirements through CBAM TRANSITIONAL REGISTRY, but rather on the methodology, modelling and calculations of CBAM embedded Carbon. The motivation is to clear up misunderstanding and misconception of what it takes to generate the required CBAM carbon footprint. Comparisons of the key differences of various carbon footprint approaches are presented and the appropriate modelling and calculation method for CBAM is explained [1].
Different approaches of Carbon Footprint Calculation: So what are the differences?
And how is CBAM Product Embedded Carbon Calculation different?
Given that there are various carbon footprint approaches out there, it is only natural that the question of whether the more commonly used corporate carbon footprint or product carbon footprint (aka Life Cycle Assessment) can be utilised to produce embedded carbon numbers for CBAM [2]. For corporate carbon footprint, the total carbon emission (e.g. MT CO2e) can be used to derive the emission intensity (e.g. MT CO2e / MT product), which ostensibly is an estimation of a product’s embedded emission.
However, both these two carbon footprint methodologies are conceptually different from the CBAM embedded carbon framework. The key differences are presented in Table 1.
Table 1 : Key differences of different carbon footprint calculation methodologies
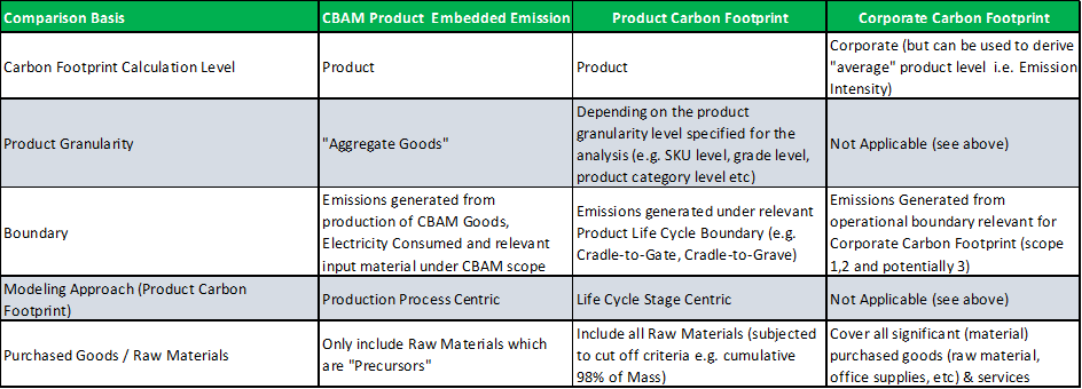
Boundary Differences
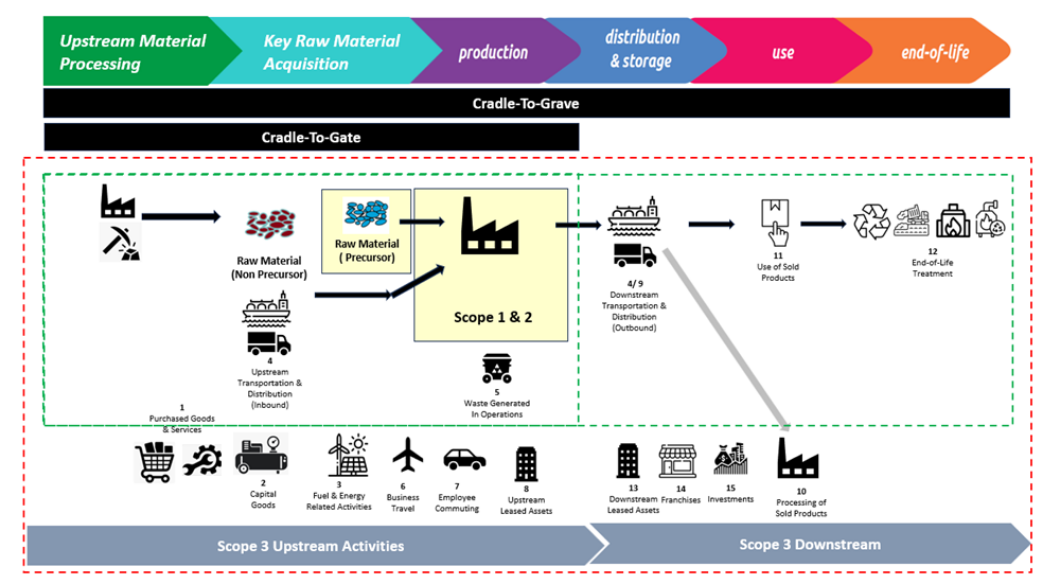
Figure 1 provides visualisation of the differences in boundaries of the 3 carbon footprint methodologies. As shown, there are major differences in terms of the boundaries used by the 3 carbon footprint methodologies. Note that CBAM methodology focusses on emissions from the production site (installation) covering scope 1 and 2 emissions (e.g. fuel combustion, process emission, electricity consumption), as well as emissions due to raw materials which are classified as precursors.
While both product carbon footprint and CBAM embedded carbon calculations are done at the Product Level, due to differences in boundary (and other factors), results from Product Carbon Footprint for CBAM products are mostly not representative of the embedded carbon results using CBAM methodology.
Figure 1 : Differences in Boundary of Corporate Carbon Footprint, Product Carbon Footprint,
CBAM Embedded Carbon

What about the scenario where Emission Intensity derived from Corporate Carbon Footprint where only scope 1 and 2 emissions are included? Would that be a good estimation of CBAM embedded carbon? Well, given that emissions from Key Raw Material precursors need to be taken into account, it is unlikely that emission intensity is a good estimation, even for the case where the production process is simple (e.g. single stage production). Exception exists for the special case where the simple production process (or multiple production process without intermediate product sales) does not have raw material inputs which are classified as precursor. An example is a Single Stage Sintered Ore plant where the key raw materials (e.g. Iron Ore, Coke Fines) are not classified as Precursors. In this special case, Emission Intensity from Corporate Carbon Footprint may be used as an estimation for CBAM embedded carbon (but this still needs to be separated into direct and indirect components, as will be explained later).
Product Carbon Footprint Modelling Approach
As mentioned, both CBAM Embedded Carbon and Product Carbon Footprint produce Carbon Footprint at Product Level. Apart from Boundary differences, here, we will show the fundamental distinctions in terms of modelling philosophies of the two methodologies. To illustrate this, we are going to use the workout example of the Aluminum Production process presented in the EU CBAM Training Webinar, Figure 2.
Figure 2 : Aluminum Production Process (source EU CBAM Webinar : Aluminum Sector)
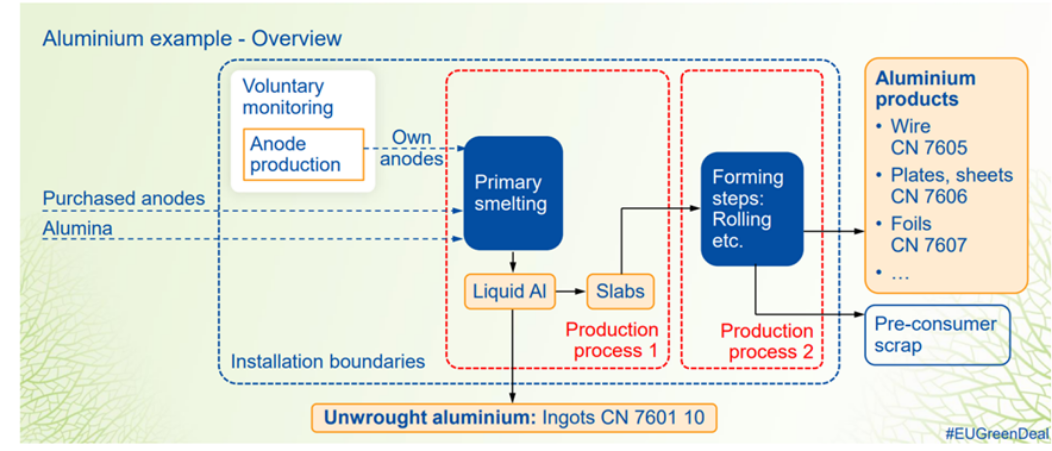
In this example, a two-stage production process is utilised to produce the final aluminium products where the key material inputs (i.e. Alumina and Anodes) are not classified as Precursors and there is an intermediate product (unwrought Aluminium) produced in between the two Production Processes. Hence, Emission Intensity generated from Corporate Carbon Footprint is not representative of the Embedded Carbon for both Unwrought Aluminium and Aluminium Products, even for the case where only Scope 1 and 2 are included in the Corporate Carbon Footprint. Let’s now review how embedded carbon modelling is done using the two Product level carbon footprint methodologies. The key differences in the modelling approach are shown in Figure3. In this example, Product Carbon Footprint Cradle-To-Gate boundary is used to keep the boundaries of the two approaches to be similar, so that we can focus on the differences in modelling approach rather than due to major boundary variations.
Figure 3 : Comparison between CBAM Embedded Carbon Methodology & Product Carbon Footprint Methodology
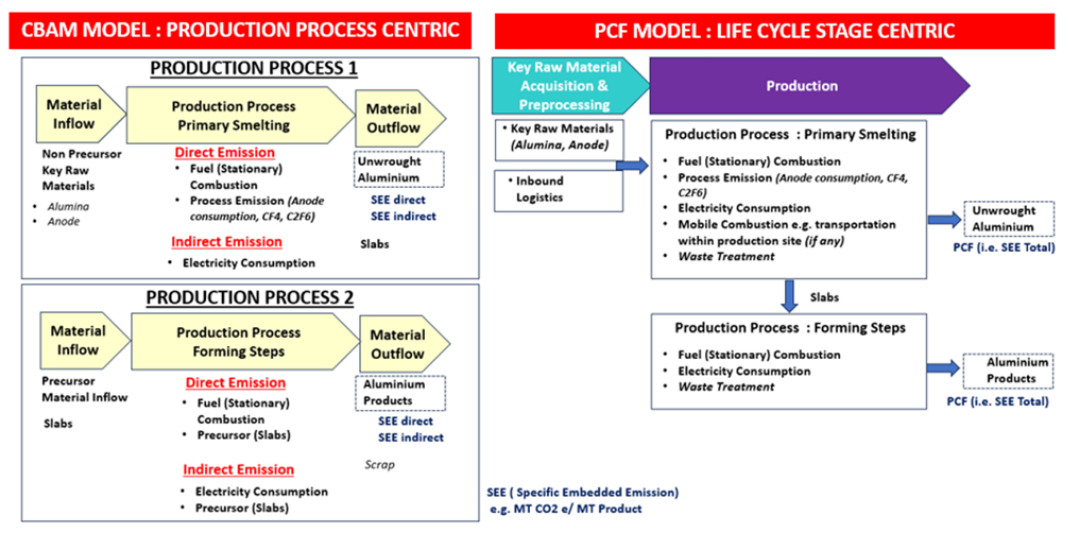
Remember we highlighted earlier that CBAM methodology is “Production Process” Centric whereas Product Carbon Footprint (PCF) methodology is “Life Cycle Stages” Centric.
Since PCF methodology focuses on emissions under life cycle stages, in the Key Raw Material Acquisition and Preprocessing Stage, emission from inbound logistics is included in the model, in addition to emissions from Key Raw Materials used. For CBAM, emission from inbound logistics is not included.
Likewise with the PCF methodology, for the Production Life Cycle stage, in principle additional emissions covered compared to CBAM methodology would include Transportation within the production sites (i.e. Mobile Combustion) and treatment of waste generated (non Waste gas, e.g. Dross). Waste gas heat recovery is covered within the CBAM methodology.
Another major difference is how emissions from Key Raw Materials is treated. CBAM would only include emissions from Key Raw Materials (or input materials to a production process, such as Slabs in the example above) which are classified as Precursor. Under PCF, emissions from all Key Raw Materials are included in the embedded Carbon Calculation.
Besides the fundamental differences outlined, under CBAM, embedded emissions need to be reported separately for Direct and Indirect Emissions (i.e. SEE direct, SEE indirect).
Essentially, CBAM specific methodology is required to model and calculate product embedded emission for the purpose of CBAM reporting rather than using “approximation” generated from Product Carbon Footprint or Emission Intensity from Corporate Product Footprint. At Smart Tradzt, we provide carbon footprint solutions covering the various carbon footprint methodologies including CBAM, PCF, Corporate Carbon Footprint (for stock exchange disclosures), as well as Industry Specific GHG reporting WITHIN A SINGLE PLATFORM
References
- As outlined by the guidance document on “ CBAM IMPLEMENTATION FOR INSTALLATION OPERATORS OUTSIDE THE EU” 8 December 2023
- Carbon footprint from monitoring and reporting methodology based on Non-EU country’s carbon pricing / compulsory emissions monitoring scheme is excluded from the analysis as this is acceptable within a certain dateline.


To find out more, please contact :
 CK Chung : ck.chung@smarttradzt.com
Osman Abu : osman.abu@smarttradzt.com